 BUT
IT IS WAY TOO HIGH TECH FOR US.
BUT
IT IS WAY TOO HIGH TECH FOR US.
GIS Learning Module 1 – Earthquake Chasers
Dear Student,
Please help us! We are the “Traveling around the Earth” TV Production Company
and we are based in California. We need a producer to make a new show for the
KNSI-9 television network. The show is called “Earthquake Chasers.”
We want your help and we need someone with knowledge and skills in these areas:
1. Earth Science and Geography
2. Geographical Information Systems (GIS).
BUT
IT IS WAY TOO HIGH TECH FOR US.
NO ONE AT KNSI-9 KNOWS ANYTHING
ABOUT GIS!!
WE WANT TO BE ABLE TO SHOW OUR
VIEWERS THE NEWEST STUFF. WE’RE
NOT AN OLD SCHOOL CHANNEL! BY THE
WAY, MY GLASSES ARE COOL AREN’T THEY?
CAN YOU HELP US????
Thank you for accepting the challenge!
Your first task is to explain what earthquakes are by using a computer software
tool called Geographic Information Systems (GIS).
Before we create the stuff for the show, you need to know what the following
icons are and what they mean:
![]() Adds
themes to the view window
Adds
themes to the view window
![]() Zooms to full
extent of the view
Zooms to full
extent of the view
![]() Zooms in on the view
Zooms in on the view
![]() Zooms out of the view
Zooms out of the view
![]() Query
Builder
Query
Builder
And, let’s get a few definitions out of the way:
§ Layer = Theme
Some people call a GIS layer a theme.
§ List of Layers = Table of Contents
Some people call a list of GIS layers a table of contents.
I am telling you these things because you will probably see both meanings used.
Don’t worry about the specific meaning of anything on this page right now. I will
go over that stuff a little later.

Introducing Dr. GIS
Hi! I’m Doctor GIS. Occasionally, I will appear in the
following exercises to tell you about a few important
GIS concepts. I look forward to sharing with you
information about this powerful technology which
happens to be my favorite subject! See you soon.
Section 1 - Introduction to Earthquake
Part 1- What’s an earthquake?
An earthquake is the shaking of the earth caused by movements in the position of
the pieces of the crust. When the energy that is stored within the earth is
suddenly released, the energy is transmitted to the surface of the Earth by
earthquake seismic waves.
Think of snapping a very long rope or garden hose very hard at one end. If you do
it right and are strong enough, you can watch the wave that you created go all the
way to the other end. You have transmitted energy from one end to the other
through this “wave” of energy. The interior of the earth can do something very
similar to this when huge pieces of the earth’s crust shift suddenly.
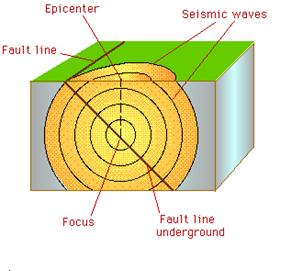
Cutaway View of a Fault and Epicenter
Source: http://cse.ssl.berkeley.edu/img/earthquakes/Epicenter.gif
The Earthquake Focus is the location within the earth where underground rock
and earth shifts and sends out the earthquake seismic waves.
The earthquake focus can occur at many depths.
§ shallow (0-70 km)
§ intermediate (70-300 km)
§ deep (300-700 km).
A Fault is the line that is created between two sections of rock or earth that
move in different directions and/or speeds.
Seismic waves are the rock and earth movements which transmits the vibration
energy outward in all directions from the earthquake focus.
The Epicenter is the point at ground level directly above the focus.
Now you know what an earthquake is.
Next, I will show you how to use a popular GIS software package called ArcExplorer Java Edition for Education. I will use this to indicate where the most earthquakes are located in the world.
Before I continue, can you guess where?
Write some places down here for fun:
___________________________________
___________________________________
___________________________________
___________________________________
Part 2 - Where are earthquakes located?
Building a base map:
Before you can plot the earthquake data, you need a world map to show their
locations.
GIS APPLICATIONS AND BASE MAPS
The base map is your “building blocks” for a GIS map.
Because GIS’s are run on computers, they allow you to
use a lot of different maps and images for the base
map. On a paper map, you only have one choice—
whatever is already printed on the paper!
1. Start the ESRI ArcExplorer Java Edition for Education (AEJEE) software
application by
doubling clicking the AEJEE icon ![]() on your desktop. If you
on your desktop. If you
cannot find it, you may have to ask for help or figure out where else you
can start the program on your computer.
2. After you get a window on your screen like the one below, click on the Add
Data
icon ![]() to
open a new view:
to
open a new view:
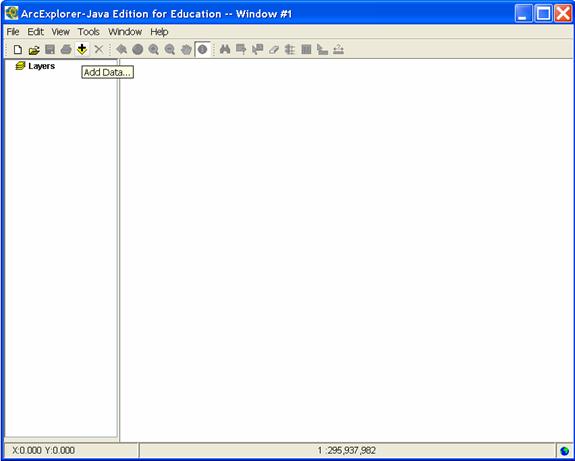
Add Data Button on Arc Explorer Java Edition for Education
3. Now we are going to load a map of the world.
You are going to need to know where the data files are on your computer’s
hard drive. If you didn’t prepare the data with the instructions at the
beginning of the learning module yourself and you don’t know where they are,
ask for help.
a. Browser on your local hard drive to the location of the data files. They
will probably be located in a folder called “seismic.”
b. After you found the folder, double click on the folder to open it then
click on
“country.shp” file
and choose ![]() .
.
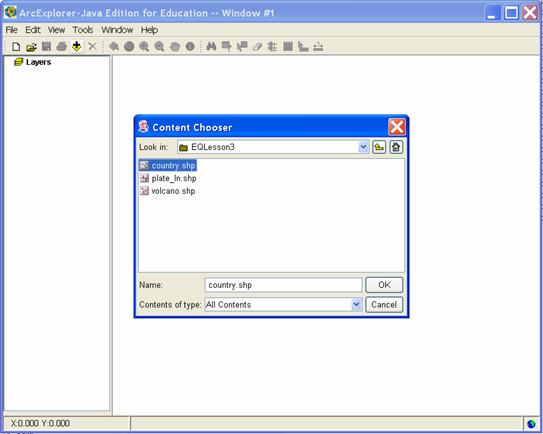
Opening the country.shp Data File
c. Now, “country” should appear under “Layers” on the left column. Now
click on the check box next to “country” to turn on the world countries layer.
Your screen should now show a world map like the picture below. Don’t
worry if it is a different color. ArcExplorer likes to use different
colors automatically.
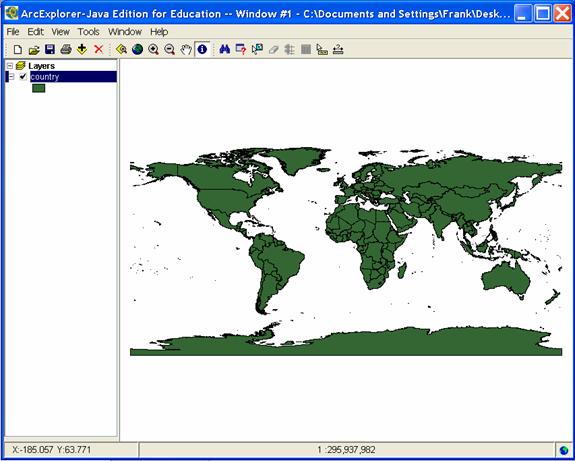
ArcExplorer with country Layer Active
LAYERS & GEOREFERENCING
Part of the power of a GIS
application is its ability to add
multiple layers of data to the same map. You can add
stuff like a countries layer, a layer of schools, a layer of
rivers, a layer of parks, and even a layer of information
like how many people live in every area (populations). Once
the layers have been added to the GIS map, you can turn
on and off layers and change how they are displayed.
You can also use the information from all of the layers together because
the same location in all of the layers represents the same location
in real life. This is called georeferencing---the locations on your GIS map
represent locations in the real world. For example, if you turned on a layer
of schools and a layer of parks in a GIS map and your school is right next
to a park in real life, it will also be right next to the park in the GIS map
even though these things were on separate layers. Can you do that with a
paper map? Not really---unless you want to draw everything on one map
and then erase what you don’t like. With a GIS, you can do that in a second
and it will look nice!
Adding the data table to your project:
We are going to add another layer of data onto your GIS map. This time we are
going to use a list of world earthquakes. This huge list contains all of the
earthquakes recorded during the years 2000. There were 46,741 earthquakes
recorded in 2000. It shows the location of the earthquake, the date of the
earthquake, the size of the earthquake, and how deep the earthquake’s focus was.
In order to plot this text data, you need to add a table containing that data to
your project.
In the following steps, whenever necessary, use the Zoom to Full Extent button
![]() to zoom out to the
entire world map. This allows you to see everything on the
to zoom out to the
entire world map. This allows you to see everything on the
entire map after you have zoomed in or out.
1. To add the data to your map, go to the View menu and choose Add Event
Theme.

Add Event Theme (Layer)
2. You will then see a dialog box which needs to be completed to tell the GIS
about this huge list of data so it knows how to organize the information and
display it for you.
a. First, choose the file on your local disk drive containing the list of
earthquakes. This file is called, “quak2000.txt”. It should be in the
“seismic” folder with the other stuff.
b. Specify the field containing the x-coordinates (left-to-right on the
screen, usually longitude) “Lon” and the field containing the y-
coordinates (up-and-down on the screen, usually latitude) “Lat.”
c. Select an Output Dir where you want the organized information to be
saved. You may be told where you need to save this information.
Otherwise, just save it in the seismic directory along with the rest of
the files.
d.
When
you are finished entering all of this information, click ![]() .
.
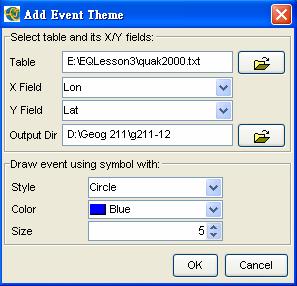
Adding Tabular Data to the GIS
The data should now be available in your map view, listed under Layers. This time
the layer is called “quak2000.”
Remember to check the box to turn the layer on to see it.
You should now see several dots representing all of those earthquakes. Again,
don’t worry if it displays the location of the earthquakes in a different color from
the sample screen.
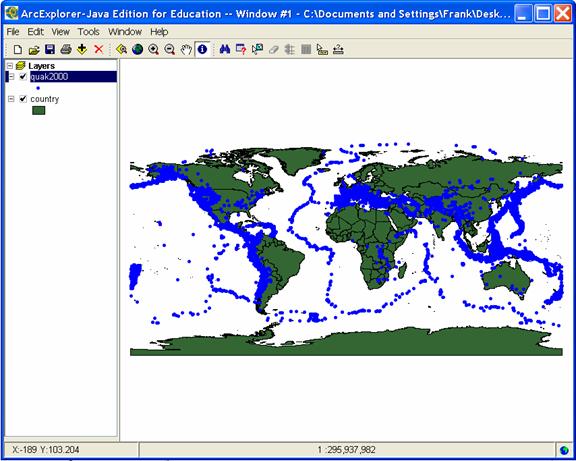
GIS Map with Locations of Earthquakes displayed on top of a Layer of World Countries
Do you notice anything interesting about the arrangement of the earthquake
dots?
Do you live next to a lot of earthquakes?
Wow! Time is up for this time. I think all of you have some knowledge about what
an earthquake is and where earthquakes are located.
Some of you may wonder about living in an area with a lot of earthquakes! Well,
you may want to know how dangerous it is by investigating the magnitude (or
“strength”) of an earthquake. That is the topic of the next section.