 The majority of earthquakes are caused from the forces of
plate
The majority of earthquakes are caused from the forces of
plate
Section 3 – Earthquake Location
Hello! It’s nice to see you again. Today is the highlight of our Earthquake program.
Everybody is watching our TV program carefully so pay attention. The TV
production company is very impressed with your work and wants a map to display
on the 7 O’clock News when they talk about that earthquake that everybody felt
this morning.
Part 4 – Why are earthquakes located where they are?
Geologists currently believe that the Earth’s surface is covered with a number of
tectonic plates that are constantly moving (V-E-R-Y slowly). Think of these
tectonic plates like the shell of an egg if the whole egg represented the earth.
If different disconnected parts of the earth’s crust are moving around all over
the place, imagine what would happen when these plates come in contact with each
other. At the plate edges, they might get pushed up or down or sideways when
they come into contact with another tectonic plate. That is where and why many–
although not all– earthquakes occur!
Earthquakes causes:
The majority of earthquakes are caused from the forces of
plate
tectonic activity. When the tectonic plates shift, they release
energy and that results earthquakes.
If you are online, view this animation of plate tectonic activity: http://www2.nature.nps.gov/geology/usgsnps/animate/pltecan.html
Now we are going to investigate using your GIS map.
To see how the earthquakes and plates are related to each other, you’ll need to
add a map layer that shows the plate boundaries.
1.
To do
this, click the Add Data icon ![]() to add the “plate_In.shp” layer.
to add the “plate_In.shp” layer.
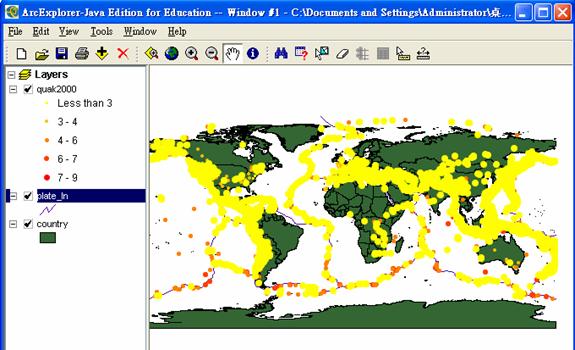
Adding the Plate Boundary Layer to the GIS Map
The lines you just added show the plate boundaries. What do you notice about the
boundaries and the location of many of the earthquakes?
If the lines of the plate tectonic boundaries are hard to see, use the layer
properties to change the way each map layer appears.
2. Right click the ”plate_In” layer and choose properties.
3. Click Style, Color and Size option menus to select various line styles, colors,
and sizes.
4. When you want to see a change, click the Apply button to see the line change.
5. Continue to make changes until you are satisfied. Click Ok when you are
satisfied with your change.
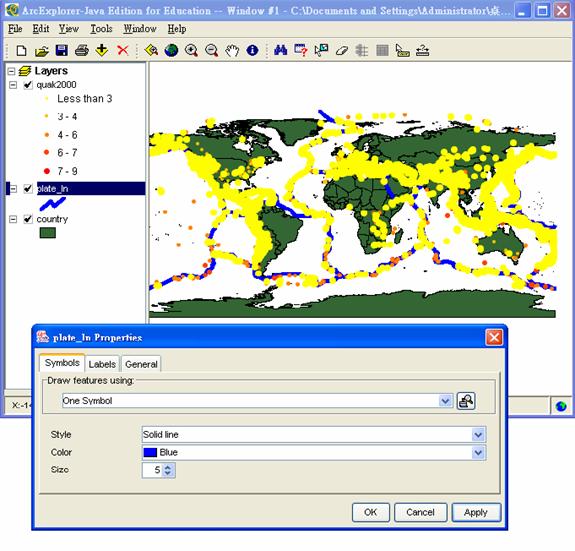
Applying Different Styles, Colors, and Sizes to a Line Symbol
Part 5 – Saving and Printing Your Work
ArcExplorer lets you save your project for a later time. You can also print a hard
copy of your map. This will be useful if you want to show other people an image
from the GIS map that you created.
The hard copy printout is what you will be providing the production company for
the 7 O’clock news program when they talk about the earthquake this morning.
1. Saving a project.
To save a project, click “File,” then “Save” or “Save As.” If you choose “Save
As,” be sure to choose a directory location to save your project file and an
appropriate project name that you will remember for next time.
2. Opening a saved project.
Go through all of the steps to start ArcExplorer. Click “File” then “Open.”
From here, browse to the location where your project file is saved and
select it to open it.
3. Printing a project.
Make sure there is a printer available for you to print on. Click “File” then
“Print.” Follow the instructions in your computer system’s printer dialog box
for a nice hard copy image from your GIS map.
It’s time to say goodbye again. Today is the final episode of our program and you
did an incredible job with the Earthquake Chasers television program as well as
providing a map for the 7 O’clock news! It was a hit and you helped teach a
lot of people about earthquakes, seismology, and plate tectonics. You also did an
amazing job with your introduction to GIS technology. Now, managers from other
television stations are trying to take you away from us because they want to learn
about GIS technology!!! But, don’t worry we have other journeys to make together
Traveling Around the Earth.